
What is all this about?
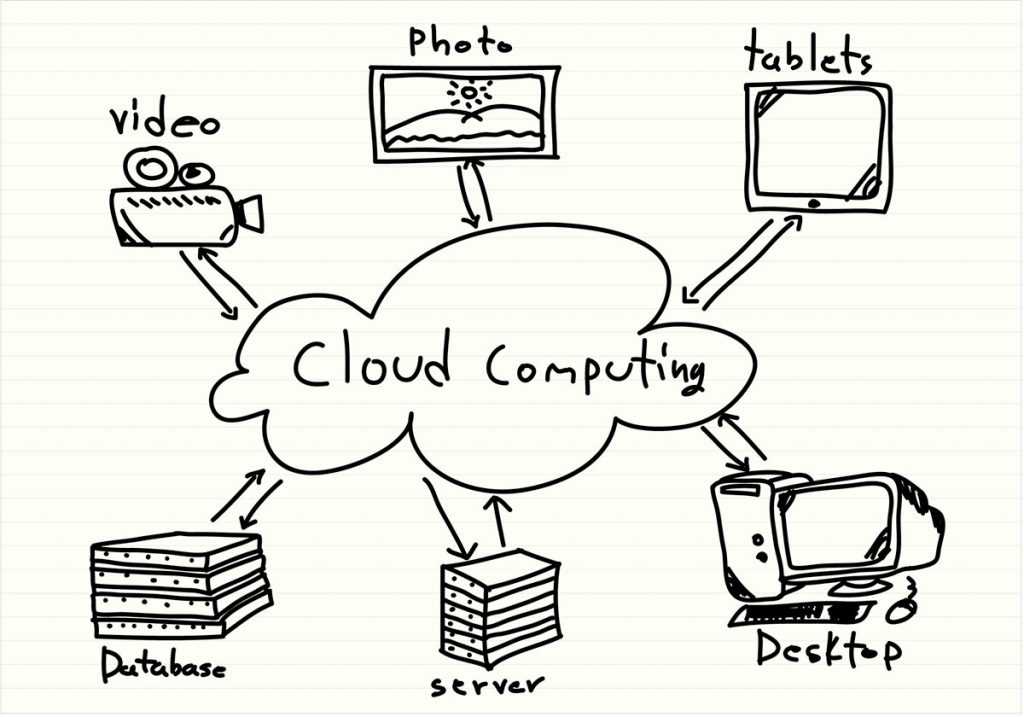
Data centers are the backbone of the modern digitalized world. Their demand is rising rapidly with the development of data-intensive technologies such as artificial intelligence and machine learning. The cloud computing paradigm −on-demand availability of computer resources, especially data storage and computing power− lies at the core of this “data revolution”. Beyond e-commerce, cloud services have become essential for other industrial sectors such as distributed manufacturing systems, logistics, finance and many others.
Data centers are energy-intensive enterprises. The global energy required to supply their computing nodes and facilities is estimated in 205 TWh for 2018 [1]. This is around 1% of the worldwide consumption of electricity [2], equivalent to the entire demand of a medium-sized country like Spain (249 TWh in 2019 [3]).

However, most users are not aware of the huge amount of energy spent by cloud services and, in particular, they are not aware of how their specific applications are contributing to the overall energy expenditure.
Is electricity a clean source of energy?
We tend to think of electricity as a clean energy source. And in some way, it is true, if we look only at the place where it is consumed. For example, unlike traditional cars, electric cars do not fill our cities with smoke and polluting gases. And the electrical appliances in our homes work in a discreet and totally harmless way with the air we breathe. However, this perception of clean energy is far from reality. Unfortunately, today, fossil fuels – or even worse, nuclear – have a significant weight in the generation of electrical energy.
That is why countries publish data on the mix of their electricity system (the percentage of energy generated with each source), and also on the tons of CO2 emitted by the generation of each of the sources. In this way, what is known as CO2 equivalent can be calculated, that is, the grams of CO2 for each kWh injected into the network. The grams of CO2 emitted per km travelled with a combustion vehicle is a similar concept, a value that manufacturers are obliged to make public and that is taken into account in the taxes paid by vehicles.
Obviously, the energy mix – and therefore the CO2 emitted – depends on each country. For example, according to data published by the US Environmental Protection Agency [4], the USA emits approximately 0.954 lb / kWh, that is, about 430g of CO2 for each kWh generated. In Europe we have a relatively greater weight of renewable energies in our mix, so the equivalent CO2 value has been lowering for some years [5]. Specifically, in 2019 the value was approximately 275g of C02 per kWh generated. Without minimizing this value, it must be taken into account that burning a litter of gasoline releases 2.64 kg of CO2.
What can we do?
The most important thing is to be aware of the energy impact of ICT systems and in particular of the applications that make intensive use of resources in the cloud. Obviously, we cannot avoid using these services but we can try to have a more rational use. In this manner, we invite you to think about the matter and we encourage you to develop good practices such as the ones we suggest below:
- Avoid downloading files or content that has already been downloaded if it is not strictly necessary.
- Do not keep sessions open when the applications are not in use.
- The consumption of streaming material (multimedia content, video games, etc.) requires significant energy resources. Define your own limits and avoid abuse.
References
[1] Eric Masanet et al. ”Recalibrating global data center energy use estimates”. Science Vol. 367, Issue 6481, February 2020.
[2] IEA (2020), ”Electricity Information: Overview”, IEA, Paris.
[3] REE (2019) “El Sistema Eléctrico Español”
[4] eGrid summary tables 2019. USA. (link)
[5] CO2 Emission intensity Europe. 2020. (link)